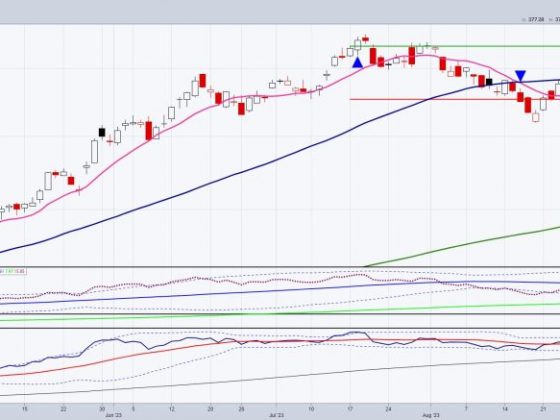
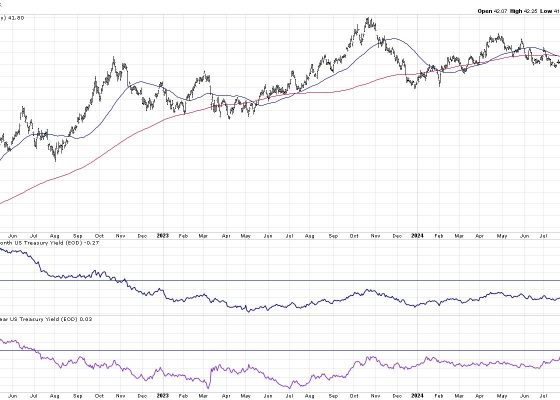
For investors, understanding the fundamentals of the stock market can be tricky. But, one of the most important things to remember is that when it comes to investing, it’s not all about the fancy valuations and complicated analysis. At the end of the day, the one thing that really matters is the stock chart. The chart can tell you what the experts’ opinion about the stock is, and can be used to make informed decisions.
For investors, it’s important to take a look at the chart to get an understanding of the stocks basic performance. The chart will show you the highs and lows of the stocks price over specific periods of time, and how it has reacted to different events. By looking at the chart, you can get a sense of how volatile the stock has been, and whether or not it is expected to continue its current trend.
To effectively use the stock chart, investors need to be aware of the various indicators that can affect how the stock price changes over time. These indicators can include news events, earnings reports, or even upcoming events. The chart can help investors to make informed decisions about when to buy, sell, or hold the stock. For example, if the chart indicates that the stock is expected to go up in the near future, it may be a good idea to buy the stock before it reaches its peak.
In conclusion, stock chart analysis can be an invaluable tool for investors when it comes to making decisions about stocks. By taking a look at the chart, investors can gain insight into the general sentiment about the stock, as well as how it is expected to perform in the future. So, the next time you are studying a particular stock, don’t forget to take a look at the chart and get informed!


