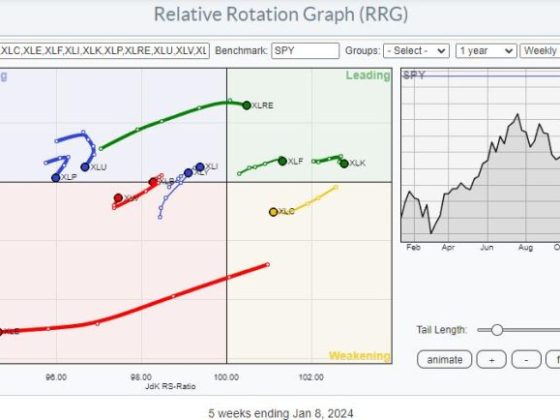
RRG Research has developed a unique measure known as Relative Rotation Graphs (RRGs) for insights on market dynamics. This proprietary analytical tool is drawing increasing attention in the financial markets for showing strong rotation for stocks in all time frames. The tool plots the relative strength and momentum for a group of stocks, from a broad market index to individual sectors or stocks.
RRGs utilize a dynamic scatter plot to capture the rotation of securities around a benchmark. The graph moves from the left (weakened phase), where stocks are lagging, through improving and leading phases to the top (peaking phase), after which stocks begin to weaken and ultimately lag again. The beauty of the RRG lies in its ability to offer a macro view of market trends across multiple timeframes in an easily comparable visual format, bringing clarity to the complex dynamics of markets.
One of the greatest strengths of RRGs is their scalability and adaptability. Whether an investor is looking at a daily, weekly, or monthly perspective, RRGs can adjust accordingly, providing vital information about both long-term and short-term movements. This flexibility means investors can use RRGs to tailor their strategies to their unique investment timeframes and goals, from short-term trading to long-term investing.
Moreover, in a departure from most comparative studies, which use price-relative comparison techniques, RRGs offer a comparison of the trend in relative strength against the trend in relative momentum, providing a clearer indication of a stock or sector’s trajectory. The magnitude of performance is projected by the distance from the center of the RRG (also known as the benchmark). Therefore, when stocks are on a strong rotation, they will show an extended distance from the RRG center, plotting their powerful trajectory on the graph.
However, this does not mean that RRGs should be used alone as a tool for making investment decisions. They are not a standalone system but rather a sophisticated mechanism to filter and verify. They are most effectively used in conjunction with other fundamental and technical analysis tools. RRGs enable traders to identify which stocks are emerging as leaders and which are lagging, but understanding the reasons behind these trends requires comprehensive sector analysis, the study of individual company fundamentals, and market sentiment analysis.
In summary, by providing an intelligent and intuitive graphical representation of relative strength and momentum, RRGs are a powerful tool for highlighting the rotation of stocks in all timeframes. Their scalability and adaptability make them an invaluable asset to investors and traders looking to gain an edge in the marketplace. Meanwhile, their distinctive approach to correlating relative strength and relative momentum offers a fresh lens through which to view market dynamics and enhance decision-making in trading and investing. With the ability to facilitate a macro perspective on market trends and the relative performance of individual stocks, Relative Rotation Graphs are a transformative addition to the investors’ toolkit.


