Understanding the SCTR Report: Unlocking TSLA’s Potential
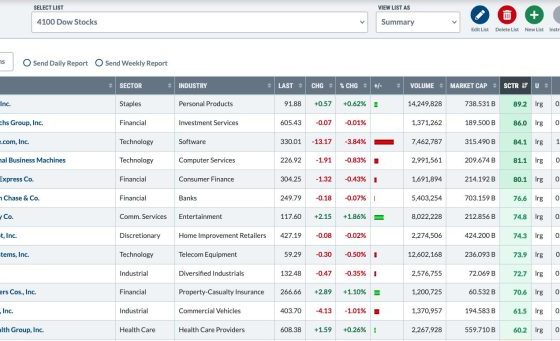
StockCharts.com ranks stocks based on technical analysis, which gives investors insights about the strength and performance of a particular stock. It’s called the StockCharts Technical Rank (SCTR) report, and it could be the key to unlocking Tesla Inc.’s (TSLA) potential for investors.
For those who are not familiar, SCTR report utilizes a unique algorithm that interested parties use to compare up to 5,000 stocks. It groups them into different categories: Large Cap, Mid Cap, Small Cap, US ETFs, and Toronto. For investors, understanding how it works is the first step to unlocking TSLA’s potential.
The SCTR report works by looking at up to six unique indicators related to a stock’s performance, it evaluates both long-term and short-term indicators. These include the rate of change in a stock’s price over specific timeframes, its comparative performance against the S&P 500 index, the exponential moving average, and the overall momentum of the stock. In addition, SCTR heavily weighs relatively large-cap stocks and/or highly liquid stocks.
TSLA’s performance on the SCTR report
TSLA is not only a large-cap stock but also one of the most actively traded securities in the world. Its high liquidity, combined with its increasing market share and influence within the auto industry, has made it a particularly compelling option for many investors.
For example, Tesla’s relative performance against the S&P 500 can be an insightful indicator. If Tesla is outperforming the index, it might suggest broader market confidence in Tesla’s future growth or profitability. Alternatively, if Tesla is underperforming, it could potentially underscore concerns about its financial health or business model.
Considering the exponential moving average (EMA), which is more heavily weighted towards recent price data, can also be instructive. A climbing EMA might suggest a trend of growing investor confidence and demand for TSLA stocks, while a decreasing EMA could potentially indicate investor skepticism or disinterest.
Moreover, another key factor to look at is the price momentum, which provides insight on whether Tesla’s stock price is on an uptrend or downtrend. It can denote whether investors are generally bullish (positive momentum) or bearish (negative momentum) on the stock.
How to use SCTR to identify investment opportunities
The SCTR report can be an immensely useful tool for investors, facilitating more informed decisions based on data rather than conjecture. The ranking system can work as an excellent starting point for further research.
The secret to successful investing in TSLA lies in the thorough and regular monitoring of the SCTR report and other relevant performance indicators. Doing so allows potential investors to spot trends, locate potential points of investment, and generally keep an eye on the health and direction of their portfolio in relation to TSLA.
In conclusion, understanding TSLA’s SCTR report is an essential process for any investor willing to unlock the vast potential of investing in this groundbreaking auto industry giant. Through careful and regular monitoring of Tesla’s performance in the SCTR report, and by coupling it with other forms of analysis, investors can make the most of the somewhat volatile but potentially profitable world of TSLA investment.
Remember, however, that while it provides important insights, the SCTR report is not the only tool that should be used when making investment decisions. It should be utilized alongside other forms of analysis and research to create a comprehensive understanding of the potential investment opportunity.


