When it comes to investment strategies, the debate between large-cap and small-cap companies is an ongoing one. By directly comparing these two using Relative Rotation Graphs (RRG), we can gain a deeper understanding of their performance and potential return on investment.
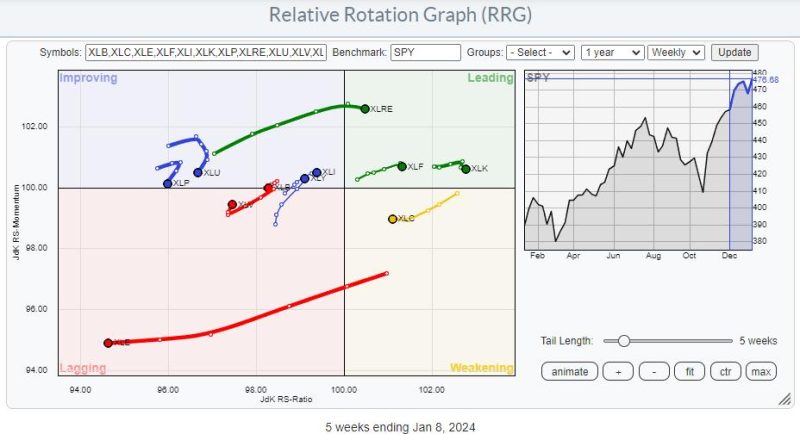
Relative Rotation Graphs (RRG) is a proprietary visualization tool developed by Julius de Kempenaer. It provides investors a top-down, holistic view of the movements and trends of various investment instruments. Investors can use RRG to compare the performance of different securities within a universe such as specific sector, index, asset class, or even between large-cap and small-cap stocks.
In the context of our debate, large-cap stocks refer to shares of the biggest companies in the market, often considered as blue-chip firms. They hold a market capitalization of over $10 billion. These companies are typically more stable, reliable and less volatile, their shares being attractive for conservative investors seeking steady and often, sizeable dividend payouts.
Small-cap companies, on the other hand, offer stocks that are from smaller companies which have market capitalizations of between $300 million to $2 billion. These companies are typically newer or operate in emerging industries or niche markets. Small-cap stocks are well-known for their high-risk high-return potential. They are less stable but offer tremendous growth opportunities and are, therefore, intriguing for risk-tolerant investors.
The large-cap/small-cap debate revolves around two aspects: stability versus growth, and risk versus return.
When we translate these debates onto an RRG chart, we’re likely to see an interesting picture. Large-cap stocks often reside in the Leading quadrant of the RRG chart. This suggests that they are steadily outperforming the benchmark index with their strong and stable performance. Investors who choose large-cap stocks using RRG as their tool will be looking for securities that are moving from improving towards leading.
Small-cap stocks, however, due to their volatile nature may be scattered throughout all four quadrants of the RRG. As with any high growth opportunities, the risk involved is directly proportional. These stocks can swing from Lagging to Leading quickly, and vice versa. In other words, using RRG charts to choose small-caps would entail selecting those that are advancing from the Lagging quadrant and moving into the Improving quadrant.
Both large-cap and small-cap stocks have their own merits and drawbacks. Large-caps offer stability and typically outperform the market in sluggish economic conditions, while small-caps tend to outperform during periods of robust economic growth.
Viewing and comparing these two using RRGs also greatly enhances our understanding. Investors should therefore exploit the strengths of each under different market conditions, aligning them with their own investment risk tolerance and goals. Through the RRG, the large cap – small cap debate is no longer a matter of preference, but becomes a discussion of tactful investment strategy.

