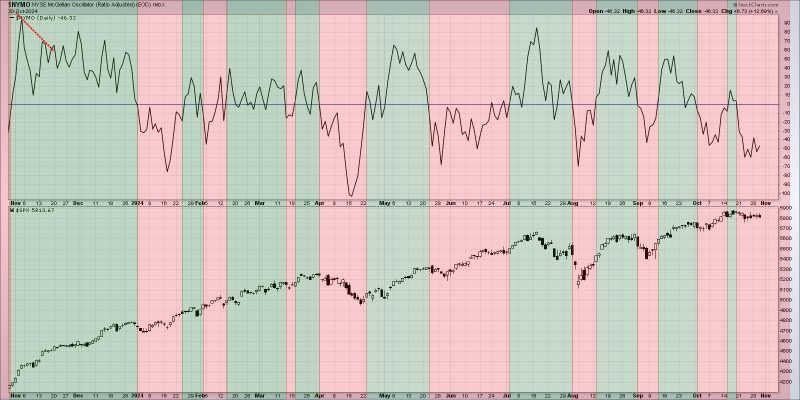
Breadth divergence, in the stock market parlance, refers to situations where the price of an index continues to rise while fewer and fewer of its constituent stocks participate in the rally. This divergence signifies a weakening market trend and believers in this school of thought contend that it could be a harbinger of an imminent market reversal or a bear market.
Understanding Breadth Divergence
Breadth divergence works by observing the momentum indicators like Advance-Decline Line (A/D Line), the Price Volume Trend (PVT), or On Balance Volume (OBV) etc., and comparing them to the market index or stock performance. In the scenario of a positive or bullish market, most, if not all, stocks are expected to follow the trend. However, during breadth divergence, even as the index levels climb, the number of advancing stocks do not match the pace, revealing a conspicuous imbalance.
Role of Breadth Divergence in Bull Markets
The advent of a bull market typically implies enhanced direct investor participation and an escalating confidence in the economy. In such a phase, general indices like the S&P 500 or the Dow Jones Industrial Average have a natural tendency to rise. All is hunky-dory when a majority of stocks mirror the index. This implies that the index’s rise is broad-based and the bull market is healthy.
However, when breadth divergence comes into play, the bullish picture begins to lose its sheen. An upticking index backed by a limited number of stocks implies that only a select group of stocks are pulling the index up. This is a clear indication of a weak and unhealthy bull market due to the lack of wider participation.
Implications of Breadth Divergence in the Market
The key consequences of breadth divergences involve the sustainability of the current bull market. If larger-cap stocks are driving the gains, but fewer and fewer smaller cap stocks are participating in the rally, this tends to demonstrate an internal weakening of the market structure.
This can be likened to seeing cracks in the foundation of a building; even though the building may appear structurally sound from the outside, the weakening foundation signals a potential for future problems. In the same way, a broadening breadth divergence could signal the end of the bull market, if not rectified, leading either to a period of market consolidation or an outright bear market.
Criticism of Breadth Divergence Indicators
A criticism of breadth divergence as a tool to predict market direction is that it is often led by a small group of high-performing, large market cap stocks, and hence may give false signals. Critics also argue that breadth divergence may too soon signal the end of a bull market while there might still be potentially profitable stock-picking opportunities.
Moreover, breadth divergence is a slow-moving measure, and an actual reversal in the market may occur significantly later than the indicator predicts, hence providing investors with a premature warning signal. The timing of market reversals is inherently challenging and reliant on multiple factors, and breadth divergence alone may not furnish a fully reliable picture.
Final Thoughts
The concept of breadth divergence is decidedly a useful tool to gauge the underlying strength of a market trend. It is, however, a just one piece of the complex puzzle that is global financial markets.
While it does operate as an early warning system for investors, it must be remembered that it does not necessarily herald an immediate shift in market dynamics. Breadth divergence data should therefore be used in conjunction with other market indicators to increase the reliability of prediction models and investment strategies.
In conclusion, while breadth divergence could potentially signal the end of a bull market, its predictive power is still a topic of much debate among market analysts and economists. As such, investors must exercise due diligence and study multiple factors to ascertain market directions.


